Increase Speed & Flexibility of College House Data
Experience the unparalleled power of data analytics with our innovative solution. Supercharge your decision-making process and stay ahead in the dynamic world of student housing analysis.
The College House Database Explorer offers organizations a seamless way to access data beyond the web platform. With a direct connection to the data that fuels all front-end visualizations on the web platform, users can effortlessly integrate their preferred BI tools, design custom graphics, and seamlessly integrate internal data sources. The Database Explorer allows for users to share invaluable insights across their organization easily.
Live Connection
Instantly access up-to-date insights and trends with our live database connection, eliminating delays and cache clearing.
Full Historical Data
Unrestricted access to complete historical data since our partnership’s inception—no time limitations.
Pre-Aggregated Metrics
Save time with our pre-aggregated data tables. Focus on extracting meaningful insights instead of complex calculations.
Connect College House Explorer Data With:
Microsoft Excel
Microsoft Power BI
Snowflake Data Cloud
Tableau Cloud
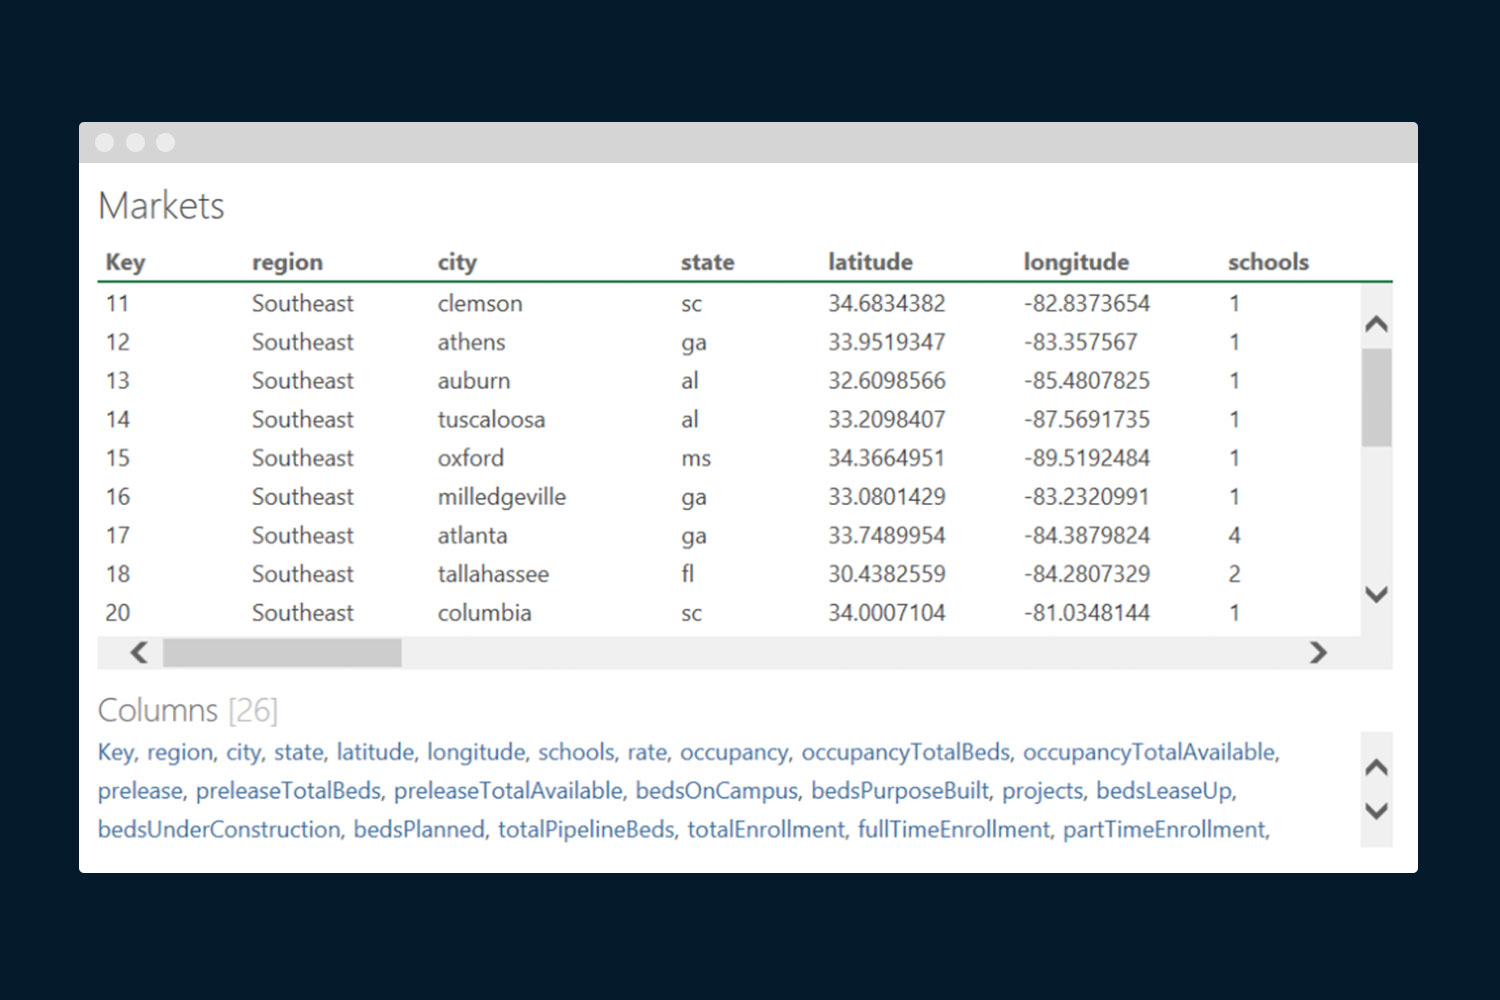
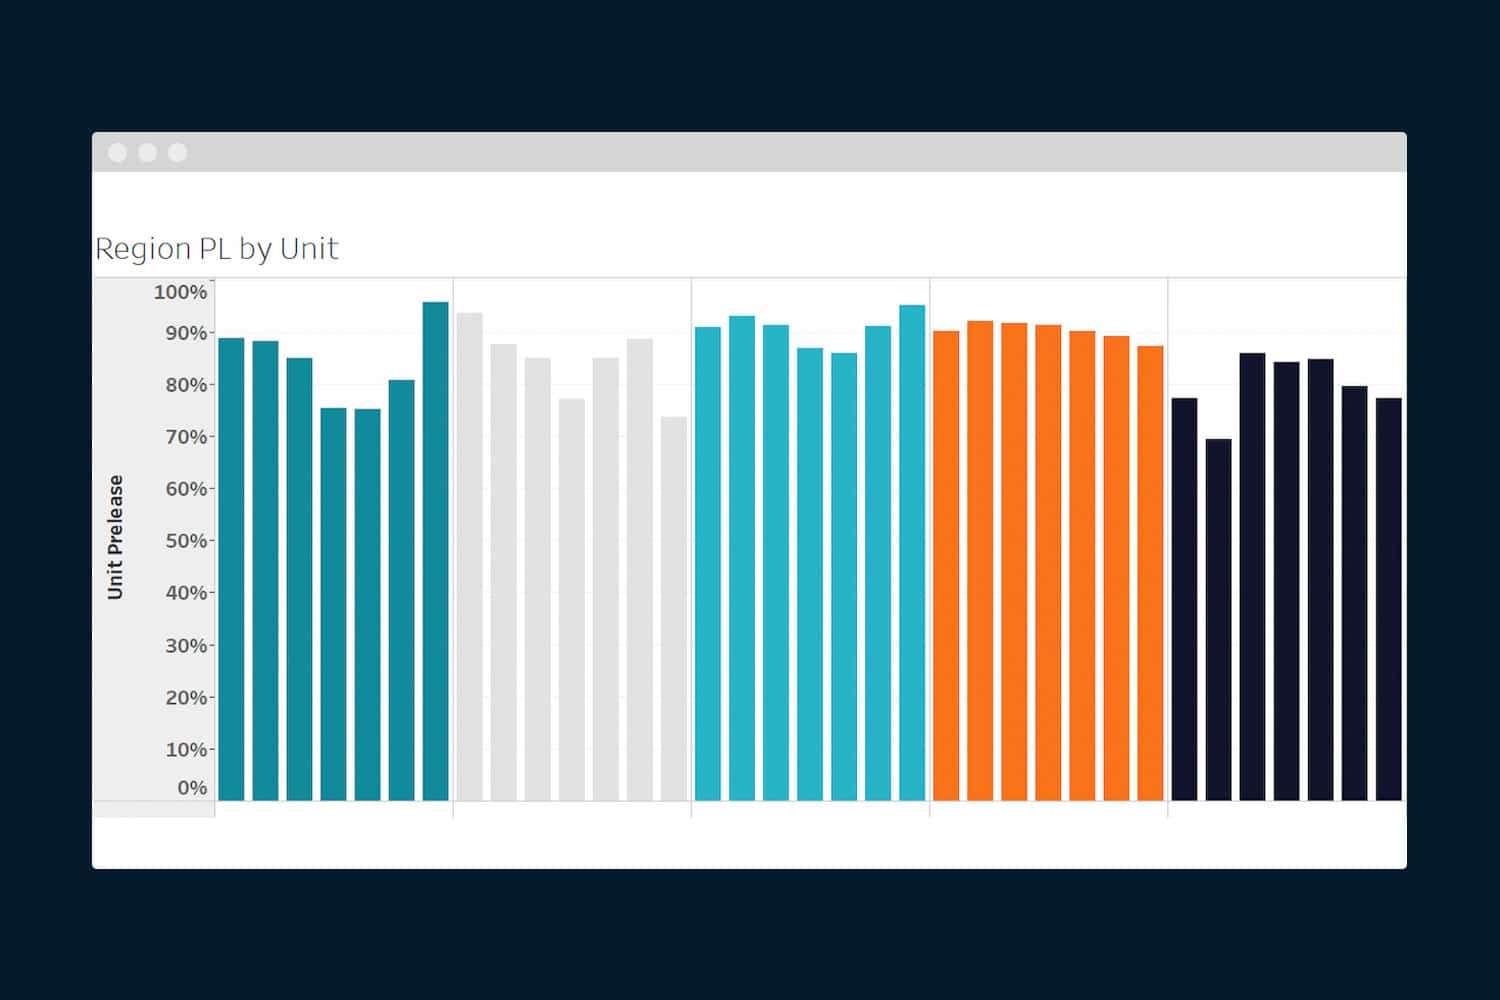
Market Data Table
The Markets Data Table offers a comprehensive view of key performance indicators (KPIs). Dive into dynamic KPIs such as average rate per bed, pre-lease, and occupancy rates, providing you with real-time metrics to make informed decisions. Explore static KPIs including the number of schools, total enrollment figures, supply and demand metrics, and location data.
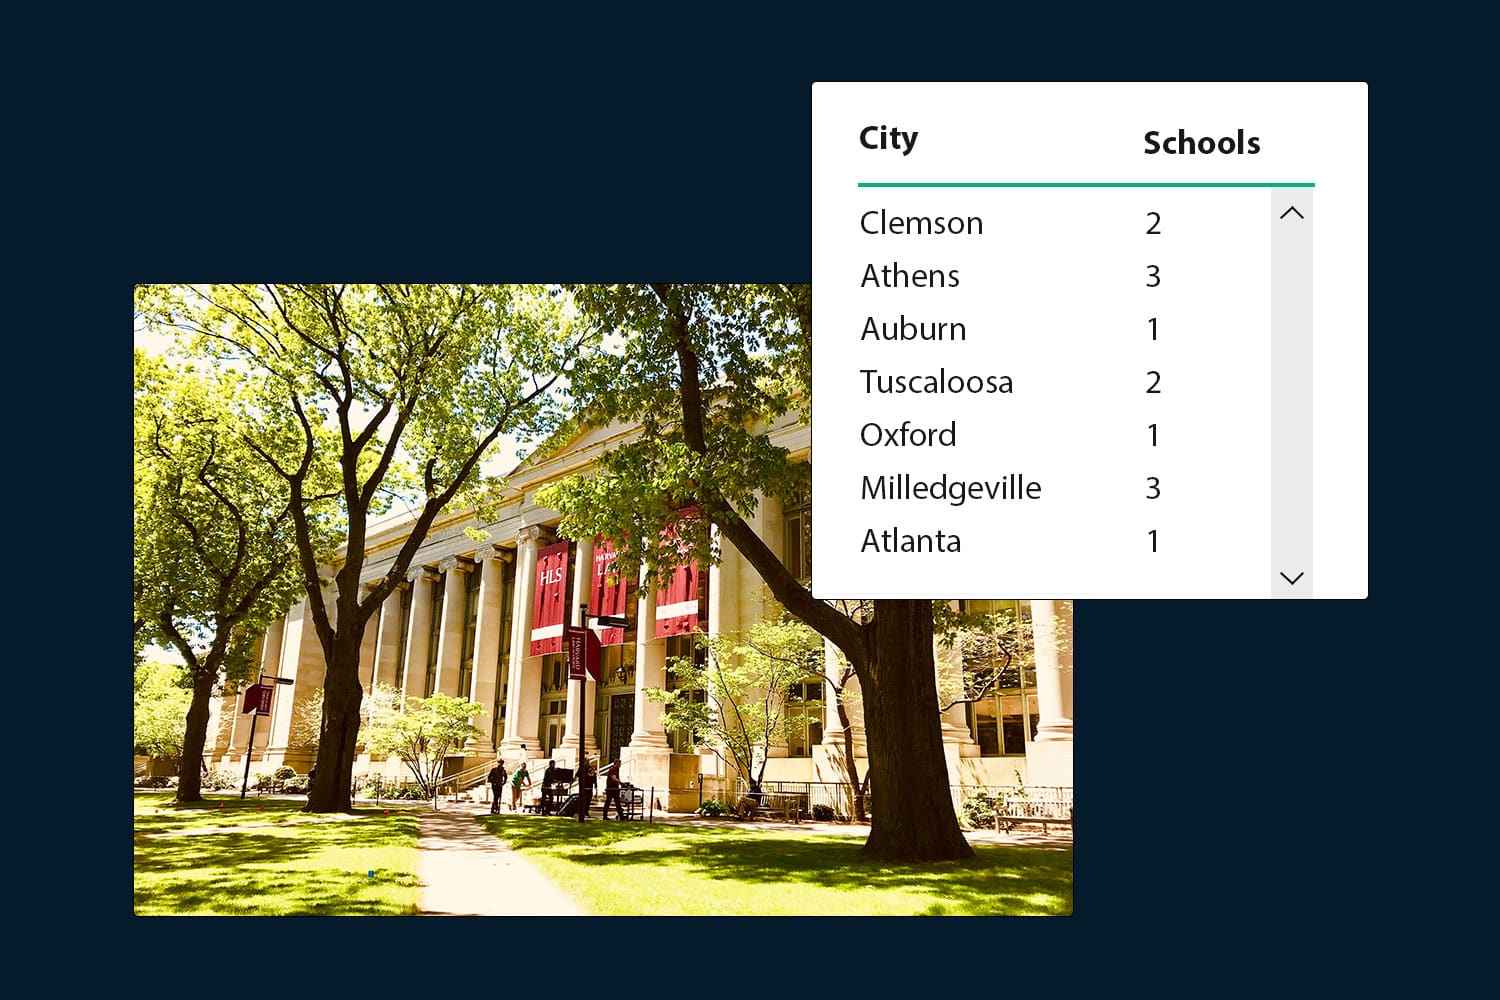
Schools Data Table
The Schools Data Table grants you access to an extensive collection of universities tracked in our database. Uncover valuable information such as university locations, names, and detailed breakdowns of on and off-campus bed distributions. With this table, you can identify universities that align with your goals and objectives.
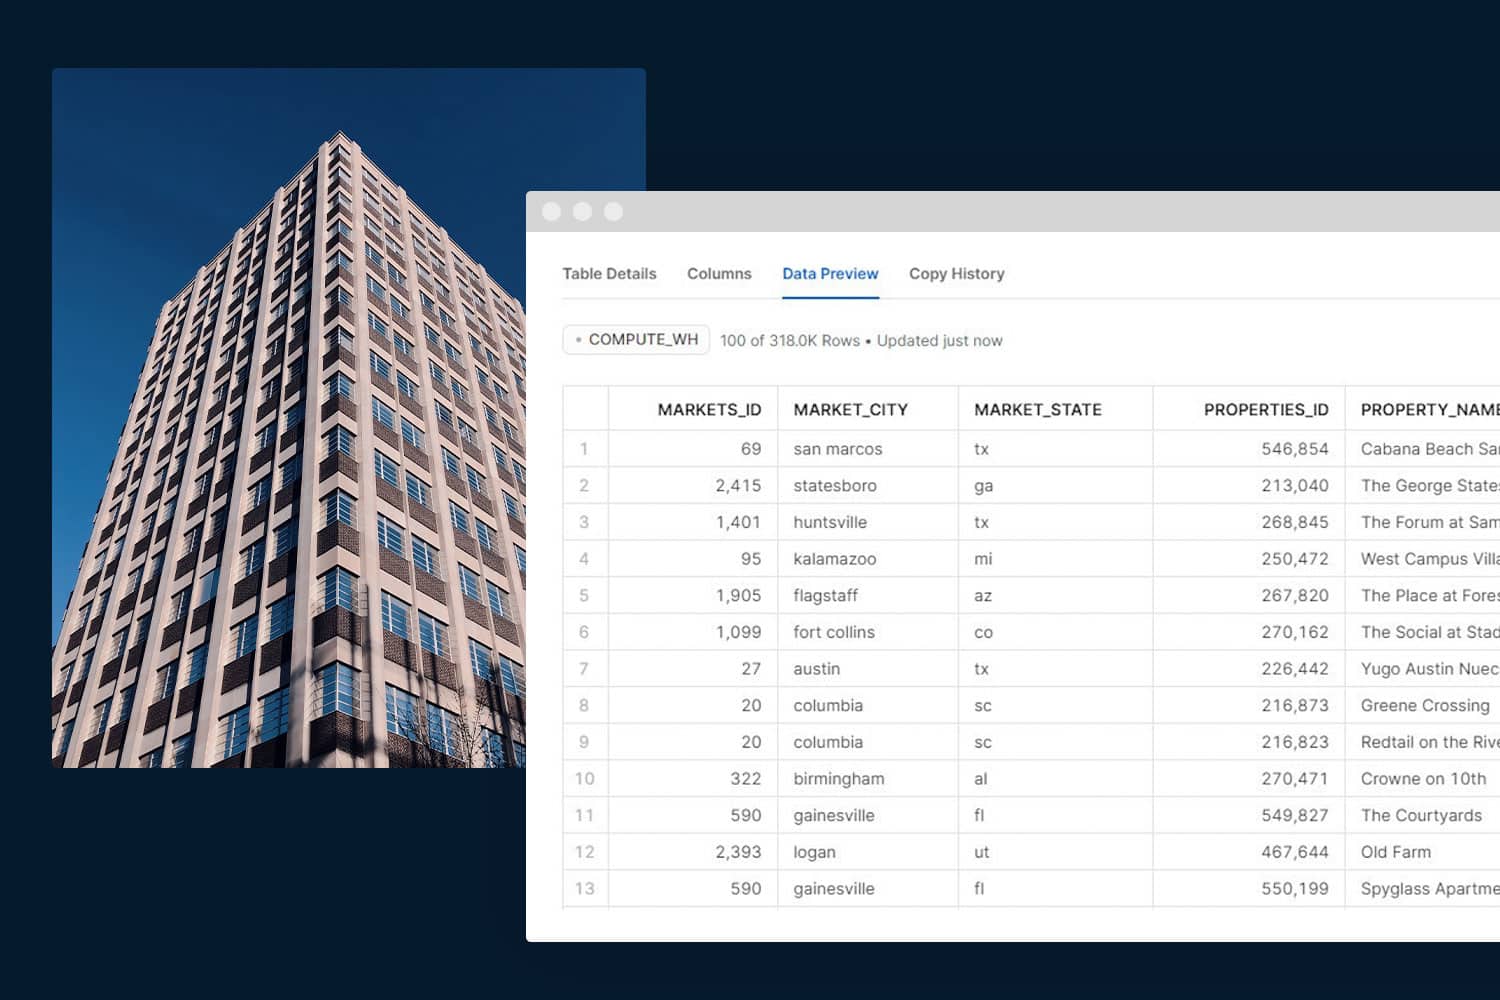
Properties Data Table
Leverage our Properties Data Table to analyze an array of performance metrics tracked at the property level. Get real-time updates on how properties are performing throughout the leasing cycle. Uncover vital information such as total beds, distance to campus, and year built, empowering you to create custom comparison sets of properties.
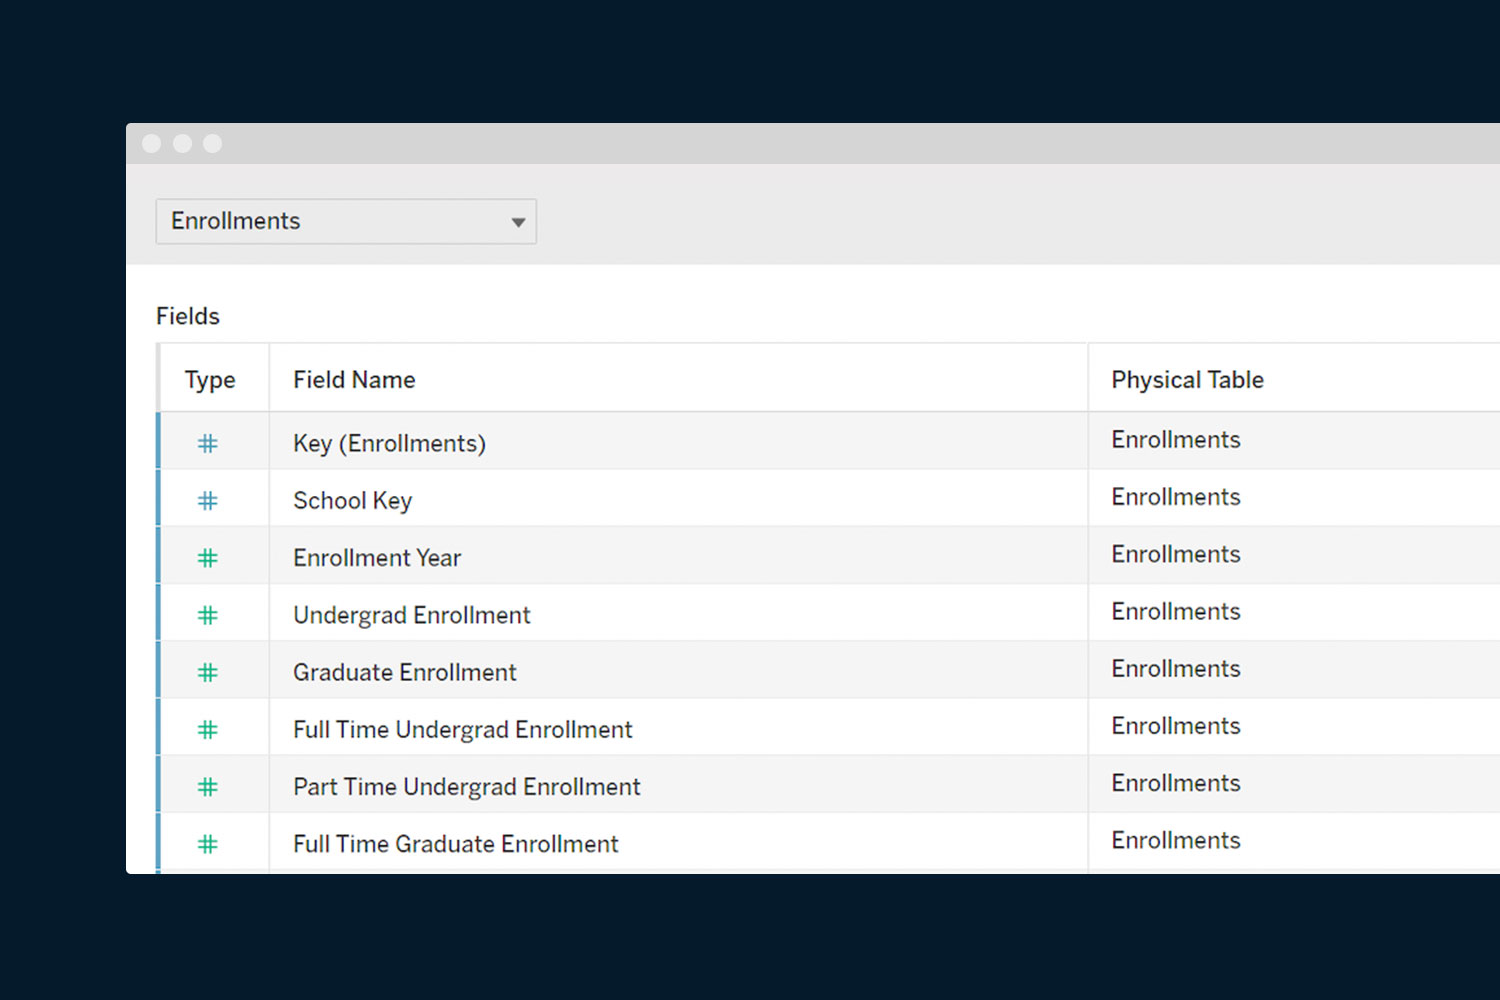
Enrollments Data Table
Use the Enrollments Data Table to track and analyze enrollment breakdowns by universities dating back to 2014. This comprehensive table allows you to understand the breakdown of undergraduate and graduate student enrollments. Gain a deeper understanding of part-time versus full-time student ratios, enabling you to tailor your strategies and allocate resources effectively.
Plans Data Table
Explore a vast collection of floor plan names, detailed bed and bath breakdowns, and accompanying square footage data for each floorplan tracked on College House, allowing for comprehensive analysis and comparison
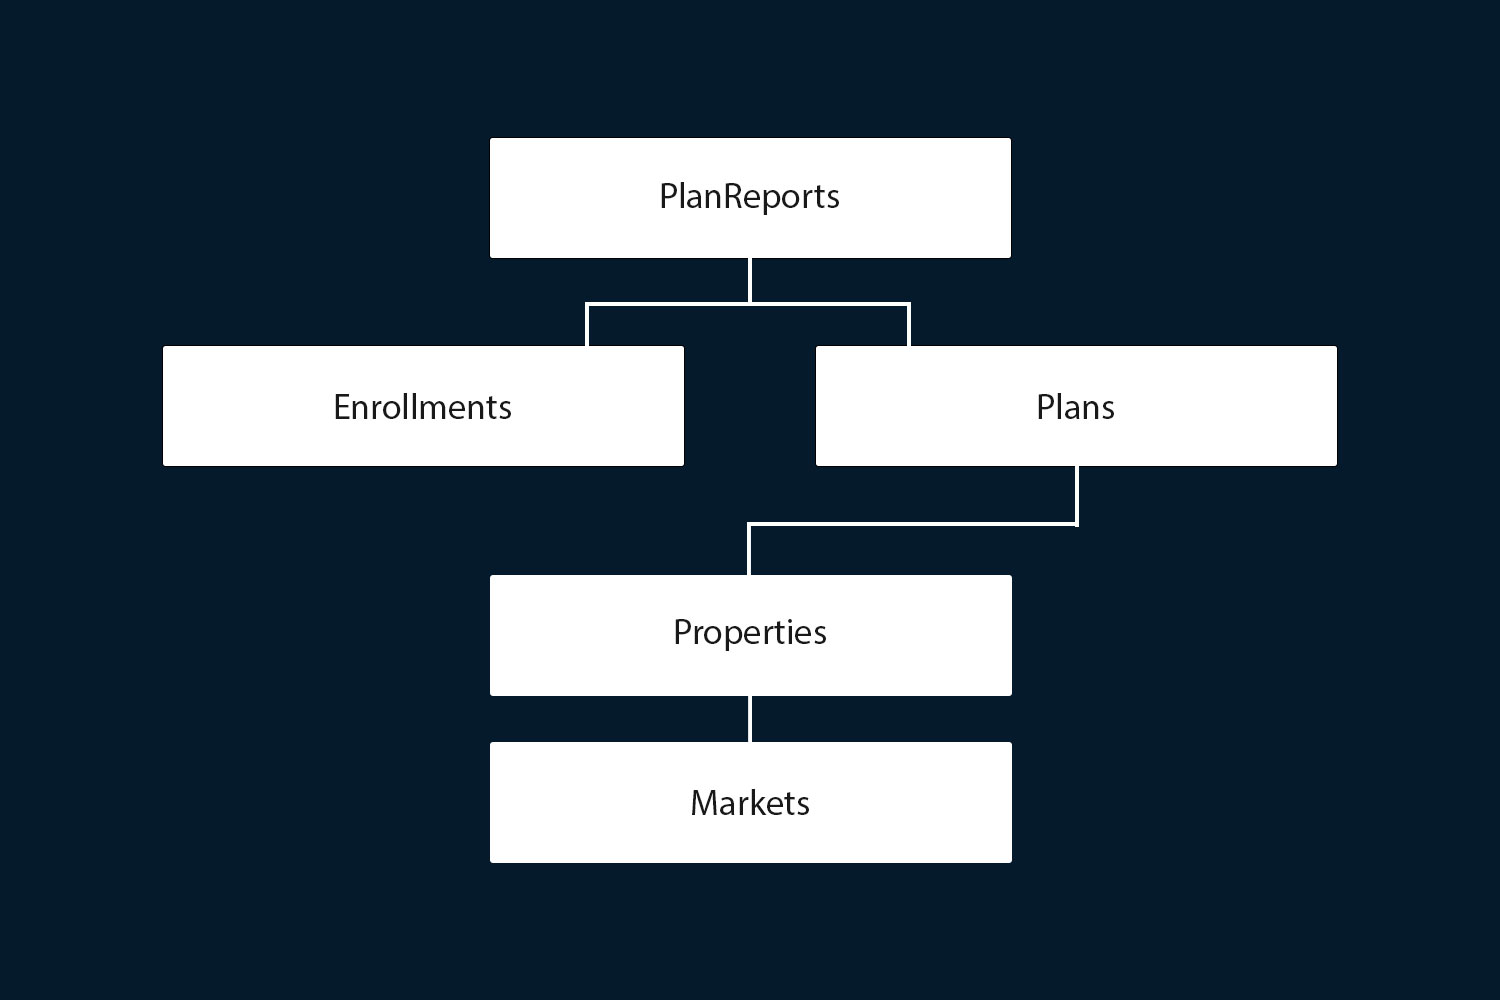
Plan Reports Data Table
The Plan Reports Data Table provides detailed KPIs at the floor plan level. This table offers the most granular data in our database covering 1.15M beds. Leverage this tool to create models that analyze top-performing floor plans in terms of occupancies, preleases, and rates, spanning across markets, regions, and the nation.
Unlock the Student Housing Market. Download Your Guide Now